FPLT - Fortran Plotting Library
Summary

FPLT is a scientific plotting library for producing high-quality (“publication-ready”) figures quickly by leveraging the GMT(Generic Mapping Tools) C-API and modern Fortran’s derived types. FPLT includes procedures for producing geographical maps, xy-plots, heat maps, animated figures, and more. The source code is available on GitHub.
| Category | Distribution | Source | Licence | Language |
|---|---|---|---|---|
| Visualisation | FPM package | GitHub | MIT | Fortran |
Software Description
FPLT is in early stages of development. Creating geographical maps works, but API may change and functionality is still incomplete.
Scope
FPLT includes a Fortran interface for several GMT modules (using GMT’s C API). Additional features, provided through an abstraction layer, include Fortran derived types for colour maps, font management, and options for specific kinds of plots. Furthermore, FPLT includes procedures for the automatic construction of colour maps and (the infamously cryptic) GMT argument strings from pre-defined or user-defined options.
The aim is to create a library that lets you:
- visualise your data directly from your Fortran programme though familiar Fortran-native constructs,
- produce professional figures quickly through the use of templates and automatic argument construction,
- modify or create new templates easily from your programme.
Examples
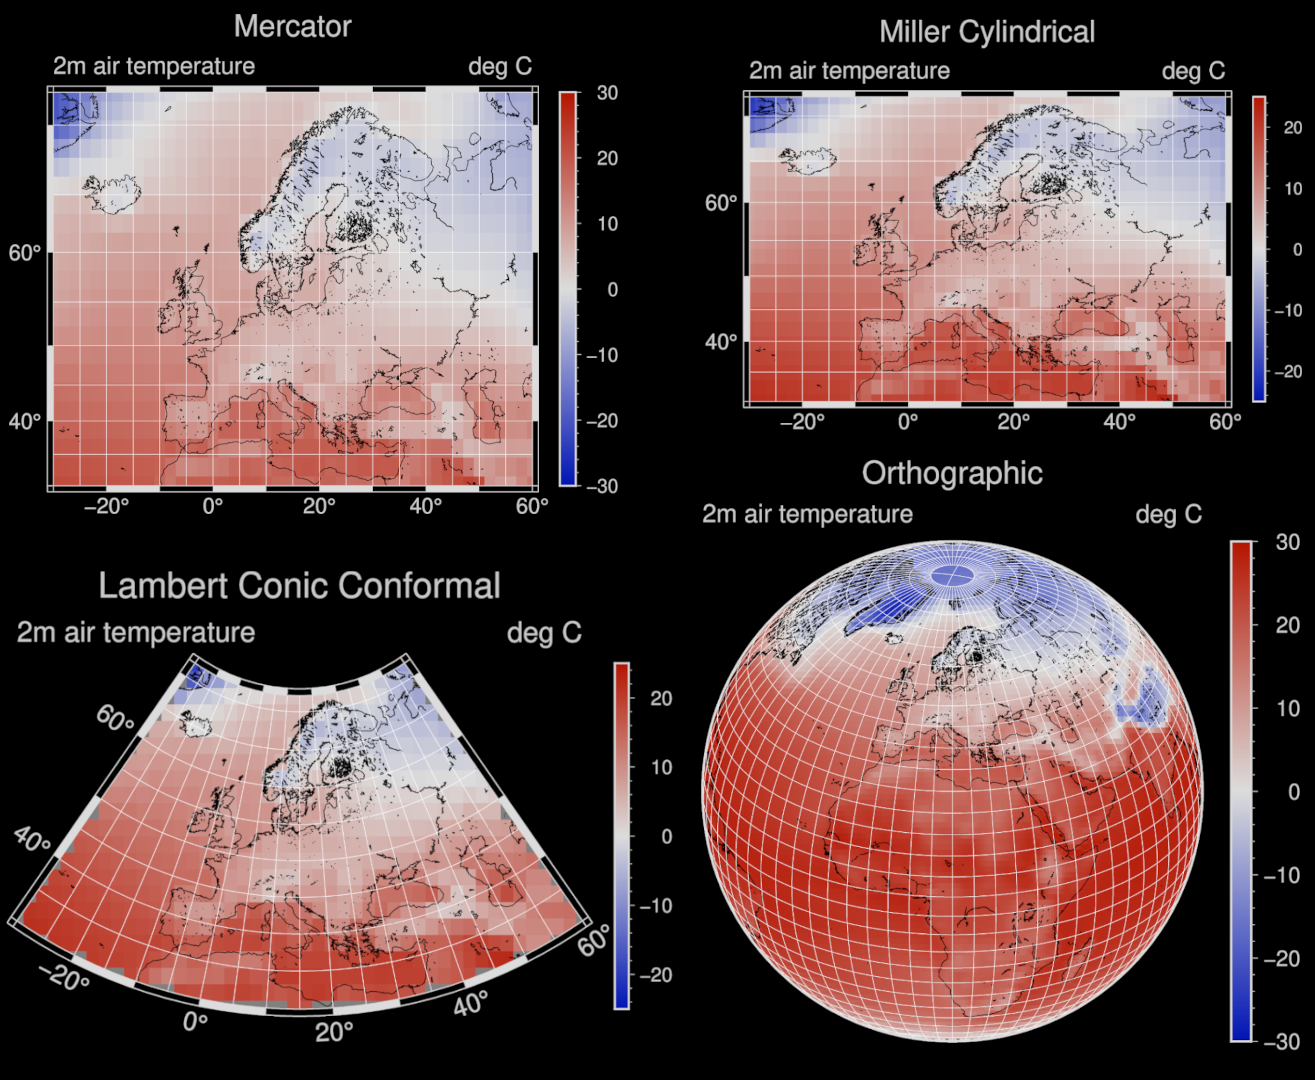
The following code modifies a colour map template cmap_bluered01 before creating a temperature map of Europe using the map_default template. All templates are simple derived types with initialised values that can be overwritten, as done with cmap_bluered01 below. The fplt_map subroutine automatically generates gmt arguments (based on map_default template) and works through a stack of gmt modules to successively build your map “behind the scenes”.
program main

! load modules and import map template to modify
  use :: fplt, my_map => DAT_map

! basic options
  implicit none

! set output file format
  my_map%infile  = "./test/maps/Mutz_et_al_2018_pd_temp2.asc"

! set plot labels
  my_map%title = "Simulated Temperature (1979-2000)"
  my_map%label_left = "2m air temperature"
  my_map%label_right= "deg C"

! change colour map
  my_map%cmap="bluered01"

! modify preset colour map
  my_map%z_min  = -30
  my_map%z_max  = 30
  my_map%z_step = 1

! change theme
  my_map%theme = "dark"

! change projection
  my_map%projection = "L"

! plot map using the modified copy of the DAT_map template
  call fplt_map(my_map)

end program main
The code above will generate the Lambert conic conformal projection map below (bottom left); not changing the projection will make FPLT default to a Mercator projection (top left). The Miller cylindrical and orthographic projection can be applied by setting the projection to J and G, respectively.